
Latest Crime Statistics Agency Victoria data shows 4,120 criminal incidents in Bayside in the year ending March 2026, down 10.6% from 4,609 a year earlier. Offences recorded and victim reports both fell too.
That overall decline doesn’t mean property crime has disappeared from the picture. It means the useful next question isn’t “is crime rising or falling,” but what’s actually inside that overall number — and what that number can and can’t tell a specific homeowner.
The data itself works at three different levels, and it’s worth being clear about which level is being discussed at each point in this article. CSA publishes figures for the Bayside Local Government Area as a whole, and within that dashboard, a suburb-level breakdown that includes Brighton. Neither level says anything about an individual street, let alone an individual property. Reading the data honestly means moving through those levels deliberately — LGA, then suburb, then acknowledging where the statistics stop — rather than jumping straight from an area-wide figure to a conclusion about one house.
Crime Fell Across Bayside in the Latest Reporting Period
Three separate CSA measures moved in the same direction over the same period:
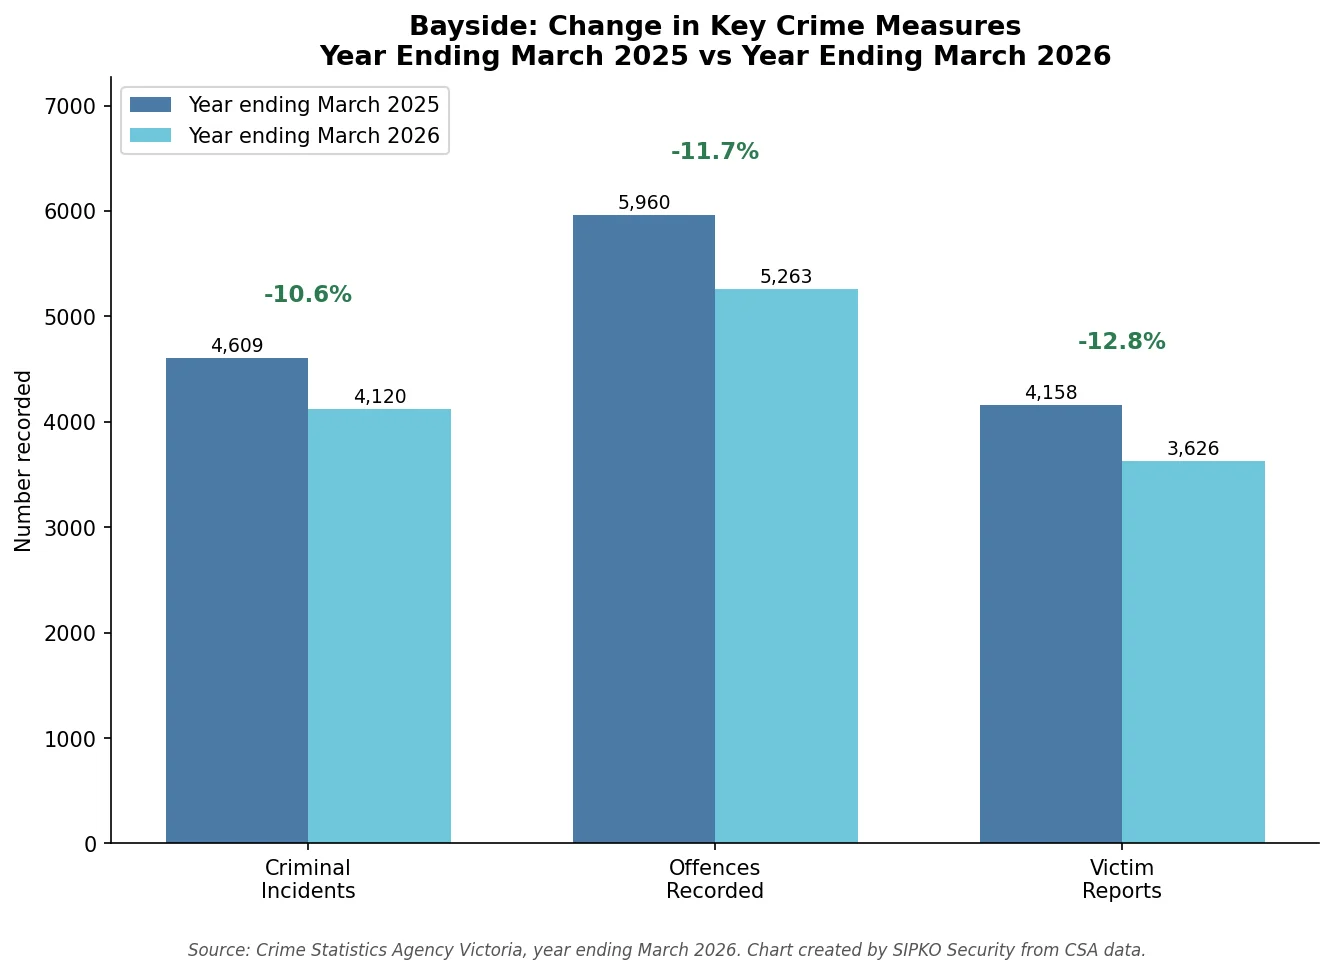
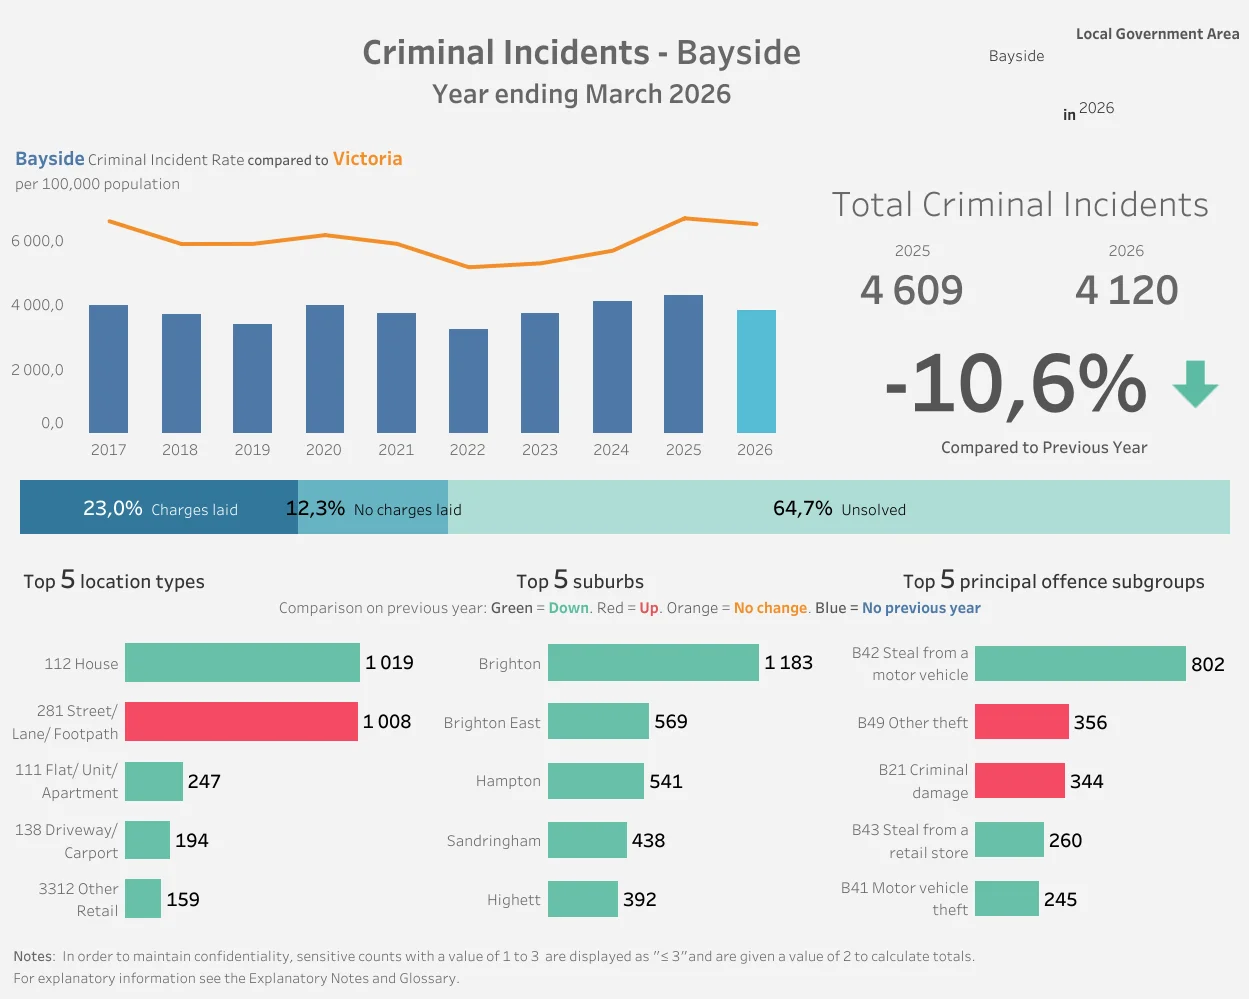
These are three separate statistical measures, not three versions of the same count — a criminal incident, a recorded offence, and a victim report are counted differently by CSA, and the three figures shouldn’t be added together or treated as interchangeable. The official CSA dashboard for Bayside makes that separation clear:
What Property Crime Still Appears in the Bayside Data?
A double-digit percentage decline across the board doesn’t mean every category fell evenly, and it doesn’t mean property-related offences dropped out of the picture. Several property-related subgroups remain clearly visible within the criminal incidents data for the year ending March 2026:
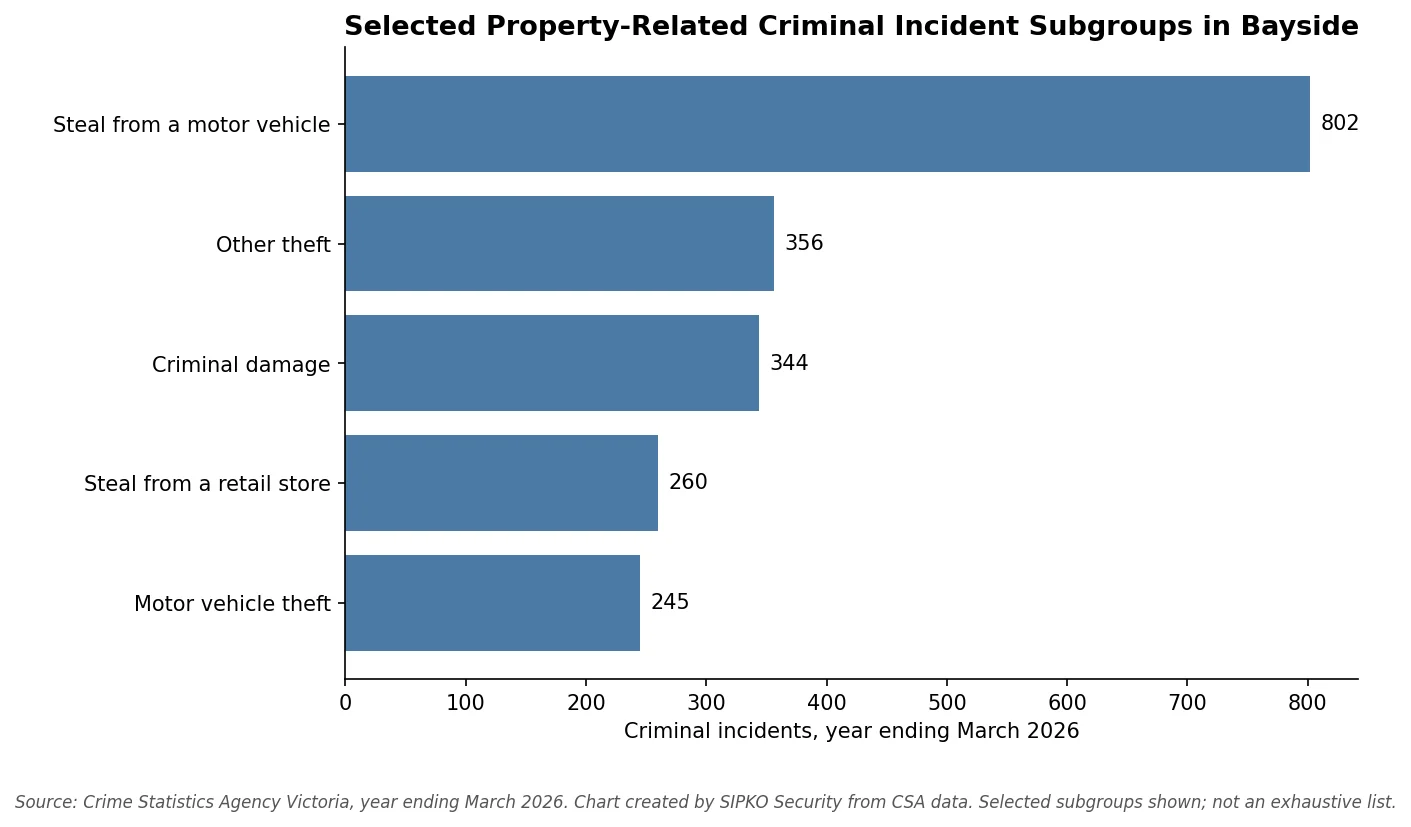
These are selected subgroups from the criminal incidents dataset, not an exhaustive list of every offence type CSA records for the LGA, and this list shouldn’t be read as a ranking of what’s most likely to affect any individual property.
Brighton Appears Prominently in the Bayside Suburb Breakdown
Bayside’s dashboard breaks the LGA total down by suburb, and Brighton records the largest count among the five suburbs the CSA dashboard displays for the year ending March 2026:
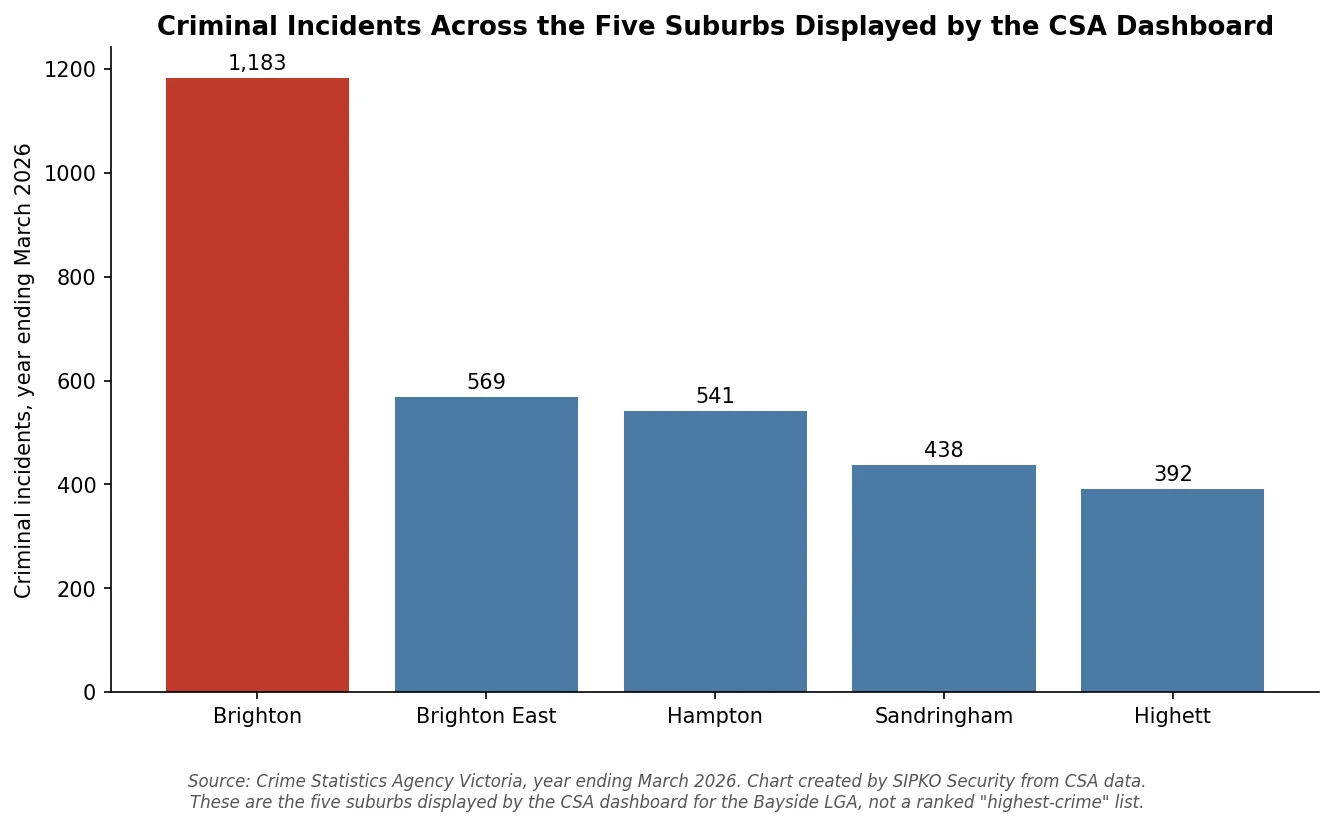
These are the five suburbs displayed by the CSA dashboard for Bayside — not necessarily every suburb in the LGA, and not a ranking of “highest-crime” areas. A raw count isn’t the same thing as a rate. A larger incident count doesn’t, by itself, establish that Brighton carries a higher risk per resident or per household than the other suburbs shown. A genuinely comparable rate would require population data at the same suburb level, which isn’t part of what this dashboard provides.
Criminal Incidents and Offences Recorded Are Not the Same Measure
It’s easy to see two different totals for what looks like the same period and assume one of them must be wrong. They’re not — they’re measuring different things. CSA’s own methodology distinguishes a criminal incident (an event, which may involve multiple offences) from a recorded offence (each individual offence within that event). That’s why Bayside shows 4,120 criminal incidents but 5,263 offences recorded for the same year: a single incident can generate more than one recorded offence.
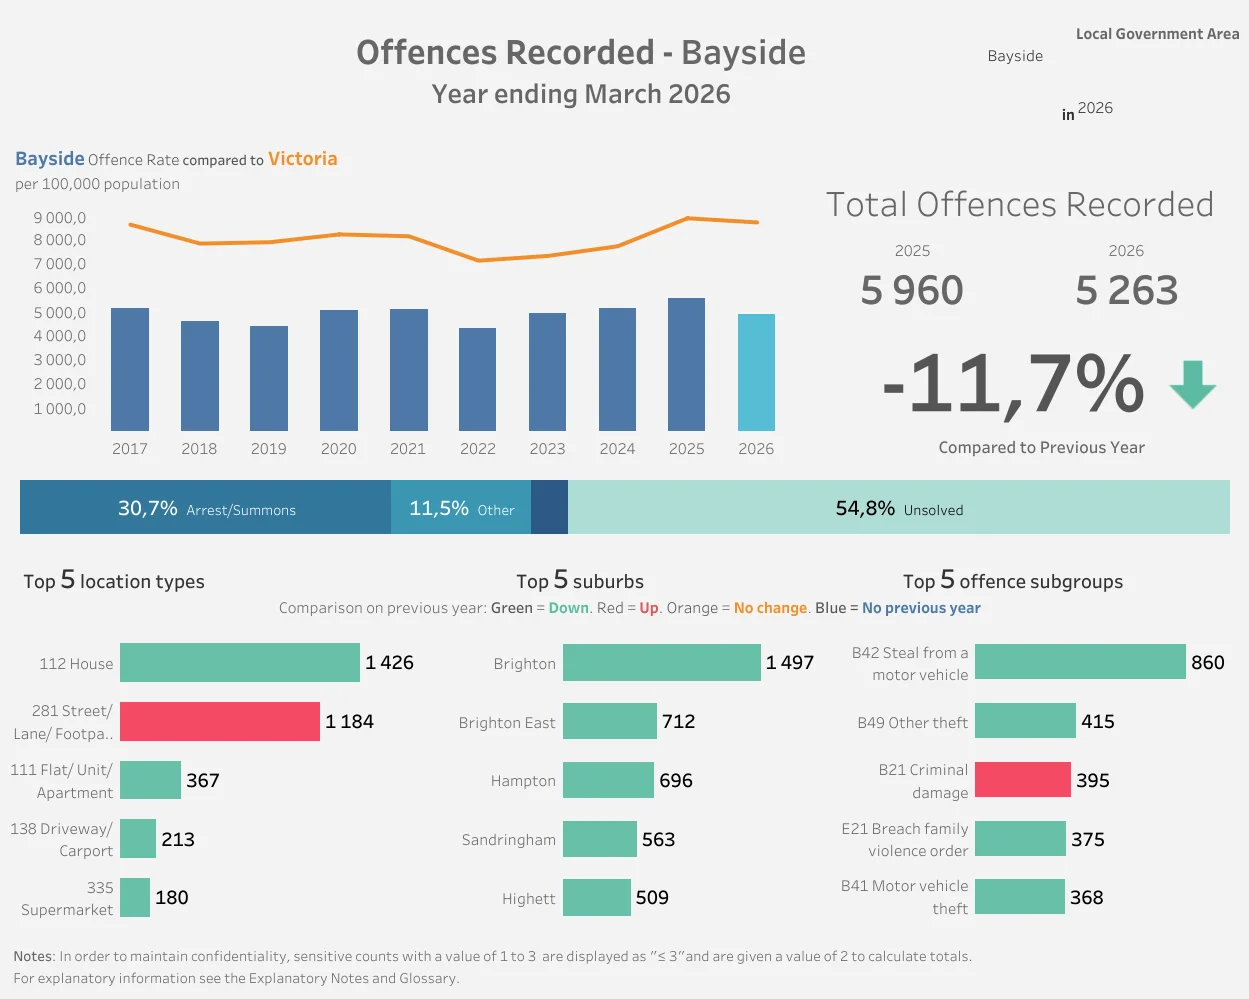
Brighton’s offences recorded figure for the year is 1,497 — a different number from its 1,183 criminal incidents, for the same reason. Neither number is more “correct” than the other; they’re answering different questions, and mixing them into one combined total would misrepresent both.
This distinction matters beyond just reading a dashboard correctly. It’s a common source of confusion when comparing figures from different years, different sources, or different suburbs — a comparison that quietly switches from one measure to the other can make a trend look sharper, flatter, or different in direction than it actually is, without anyone involved intending to mislead. Checking which measure is actually being cited is a small habit that avoids a real category of error.
Theft, Burglary and Property Damage Remain Part of the Picture
CSA’s Victim Reports dataset provides another view of the Bayside figures. For the year ending March 2026, the top offence subdivisions affecting property include:
These figures shouldn’t be compared directly against the criminal incidents subgroup counts above — they come from a separate dataset with its own counting rules. What’s worth noting is that property damage was the one category among these that increased, even as the broader victim-report total for Bayside fell by 12.8% overall. That’s a useful reminder that an overall decline doesn’t mean every category moved the same way.
What the Crime Data Cannot Tell You About a Brighton Home
Everything above describes an area. None of it describes a specific property, and CSA statistics were never designed to. The dashboard has no way of knowing:
- whether a particular home has a long driveway that’s hard to see from the street
- whether trees or hedges block the view of an entry point
- where a side gate sits, or whether it’s visible from the road
- whether there’s a detached garage separate from the main house
- where vehicles are typically parked overnight
- whether an existing camera can actually identify a person, rather than just detect movement
- whether alarm coverage exists at all, or where its gaps are
- how often the property sits empty, and for how long
- whether existing CCTV performs adequately after dark
- whether footage from an existing system would actually be usable if something happened
One data point CSA does break out separately is worth mentioning here: Driveway/Carport appears as a distinct location type in the Bayside data, with 194 criminal incidents and 213 offences recorded for the year ending March 2026. That shows Driveway/Carport is separately identified as a location type in the official Bayside data — but it says nothing about the layout, lighting, sightlines or camera coverage of any individual driveway. Those are property-level questions that matter when planning security camera installation, but they cannot be answered from suburb crime statistics alone.
From Local Crime Data to Property-Specific Security
None of this means every Brighton home needs the same response, or that area-level statistics translate directly into a purchase decision. What the data can reasonably do is point toward categories worth thinking through for a specific property, without pretending it can tell you what that property specifically needs:
- Vehicle-related risk points toward the driveway, the vehicle’s approach path, and whether an entry point actually allows for identification, not just detection.
- Entry-related concern points toward doors, side access and gates as the physical points that matter.
- Extended absence points toward reliable remote visibility rather than assuming a property is watched simply because equipment exists.
- General intrusion detection points toward whether a professionally planned security alarm system actually covers the areas that matter for that property.
None of this is a guarantee that any particular measure prevents an incident. It’s a way of translating a category that shows up in area-level data into the kind of question a property-specific assessment can actually answer.
The gap between area-level statistics and property-level design is exactly where an on-site assessment does work a dashboard can’t. Two houses on the same Brighton street, both sitting inside the same 1,183-incident suburb count, can have entirely different practical needs depending on how each one is actually laid out — one with a long, screened driveway and no rear lighting, the other with clear sightlines and a well-lit side gate. The area figure is identical for both. What each property actually needs isn’t. SIPKO Security provides security camera installation across Melbourne, including when planning CCTV for a Brighton home, and that kind of assessment — driveway layout, entry points, existing coverage gaps — is where the conversation moves once the area-level picture has been read correctly.
Frequently Asked Questions
Is crime increasing in Bayside?
No. The latest Crime Statistics Agency Victoria figures show criminal incidents fell 10.6% year-on-year for the year ending March 2026, alongside declines in offences recorded and victim reports.
How many criminal incidents were recorded for Brighton?
Brighton recorded 1,183 criminal incidents in the year ending March 2026 — the largest count among the five suburbs shown in the Bayside CSA dashboard. That’s a suburb-level count, not a population-adjusted rate, so it shouldn’t be read as evidence that Brighton has the highest crime rate in the area.
Which property-related offence subgroups appear in the Bayside criminal incidents data?
Within the criminal incidents dataset, “steal from a motor vehicle” was the largest property-related subgroup at 802, followed by other theft, criminal damage, steal from a retail store, and motor vehicle theft.
Does local crime data tell me whether my home needs CCTV or an alarm?
No. Area-level data can show which categories of offence occur in a region, but it has no visibility into an individual property’s layout, entry points, or existing coverage. That assessment has to happen at the property, not from a dashboard.
Methodology and Data Source
Source: Crime Statistics Agency Victoria
Dataset/dashboard: Latest crime data by area
Geography: Bayside Local Government Area
Reporting period: Year ending March 2026
Accessed: September 2026
Brighton treatment: Suburb-level figures as displayed within the Bayside LGA dashboard; not independently population-adjusted by SIPKO Security.
Charts: Created by SIPKO Security from values displayed by CSA. Official CSA dashboard screenshots are reproduced separately and labelled as such.
Limitations: Suburb-level raw counts are not population-adjusted rates. Area-level statistics describe a local government area and its suburbs; they do not measure the risk to any individual property. Criminal incidents, offences recorded, and victim reports are three distinct CSA measures with different counting rules and should not be combined or directly compared.